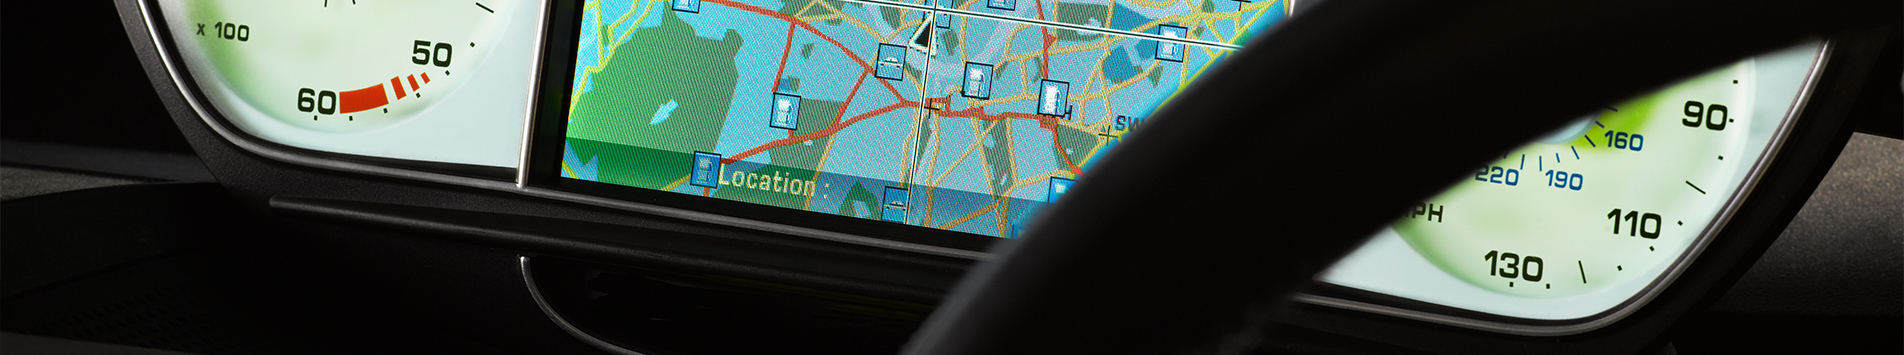
When looking at a map – paper or digital – you are looking at layers of information that collectively give you the full picture. Integrating information about parameters – like vegetation, streets, buildings, or terrains – can allow you to identify, understand and analyse patterns and relationships between different parameters. For digital maps, a geographic information system (GIS) is responsible for capturing, storing, verifying, and displaying this data, which facilitates GIS mapping and a more insightful view of any location.
A GIS can use different types of geospatial data to store different types of information, with different utilities in diverse industry segments. The two main types of geospatial data are vector and raster data. This article discusses these two and other data types in detail.
Vector data
Vector data stores parameters that have discrete boundaries in the form of points, lines, or polygons. This is the spatial data most people are familiar with and use – when accessing applications like Google Maps – to see maps of countries or states, roadways, or railway lines.
The three types of vector data are:
- Point Data: Point data typically represents a distinct data point with zero dimensions; you cannot measure the length or area of these points. Examples of point data include cities, schools, or other points of interest on the maps.
- Line Data: The one-dimensional line data (or arc data) represents linear features, like rivers, trails, streets, or railway lines, and records only length. Different representations, like, solid lines, dashed lines, or different colours and thicknesses can distinguish different linear features on the maps.
- Polygon Data: Polygon data typically represents areas of features like cities, forests, or lakes. It is two-dimensional and can give insights into the area and perimeter of the geographical features. Different colour schemes or patterns can distinguish different polygon features.
Vector images are a high-quality representation of geographical features; you can enlarge, stretch, or reduce them without losing quality.
Raster data
Raster data, or grid data, comprises a matrix of cells, with each cell representing a specific value (or geospatial information). Typical examples of raster data include satellite imagery, digital elevation models (or topographic maps), scans of paper maps and aerial surveys. Raster data finds applications in disaster management, meteorology, and industries where risk analysis is critical.
The two types of raster data are:
- Continuous data, where grid cells change gradually from a fixed registration (or reference) point. For example, digital elevation models using sea level as a registration point and each cell representing elevation value above or below sea level.
- Discrete data, where grid cells can only take a specific value and are well-defined within a specific class. For example, in a discrete land use map, you can see the boundaries of each thematic class.
However, unlike vector data, raster data is not scalable and can pixelate or distort if you try to enlarge or stretch it.
Geotemporal Data
Geotemporal data combines the two types of geospatial data with a temporal component. This may be vector or raster data, like the progression of a vehicle over time or satellite imagery over a set time interval.
Different types of geospatial data can have different applications when representing people, places and things on earth. You can use geospatial data and geospatial analytics services to monitor and track:
- Points of interest
- Property
- Mobility
- Demographics
- Addresses
- Boundaries
- Environment
- Streets
You need to determine what geospatial data type is relevant to your business problem and then focus on collecting, analysing and visualising that information.
For organisations on the digital transformation journey, agility is key in responding to a rapidly changing technology and business landscape. Now more than ever, it is crucial to deliver and exceed organisational expectations with a robust digital mindset backed by innovation. Enabling businesses to sense, learn, respond, and evolve like living organisms will be imperative for business excellence. A comprehensive yet modular suite of services is doing precisely that. Equipping organisations with intuitive decision-making automatically at scale, actionable insights based on real-time solutions, anytime/anywhere experience, and in-depth data visibility across functions leading to hyper-productivity, Live Enterprise is building connected organisations that are innovating collaboratively for the future.
how can Infosys BPM help?
Infosys BPM Geospatial Data solutions leverage the latest digital technology to address your mapping needs. With Infosys BPM geospatial analytics services, you can collect, store, manage, analyse and map any type of geospatial data you need and resolve your business problems.