Digital Interactive Services
Leveraging GIS to understand the impact of COVID-19 on business continuity measures
The world is fighting with one of the biggest pandemic, Coronavirus or COVID-19. The lockdown that followed has brought the world to a grinding halt. The virus has killed scores of people, disrupted supply chains, battered the industries and thus the economy.
If appropriate and timely measures are not taken, the crisis can multiply with unforeseen magnitude. Healthcare consultants, government decision makers, and institutions at ground-level, as a result, have collaborated to generate real-time information and public awareness. It is also essential that the IT community comes together to leverage smart intelligence platforms and provide digital expertise to the government, organizations, and health agencies. Geographical Information System (GIS) technology solutions, analytics, and big data are few of the services that can be leveraged to understand the situation better and take informed decisions in a timely manner.
The entire spread of the COVID-19 virus is spatial in nature and location plays an important role in taking effective decisions. Location intelligence helps in exploring dynamic connections between people, their health and well-being, changing physical and social environments. This can be of assistance to the authorities in monitoring and communicating the impact of the outbreak.
GIS to track the spread of COVID-19
GIS service based decision making tools have often been used by epidemiologists and related agencies to study the pattern of past epidemics, such as Ebola and Polio. The comparative study through GIS can help us to understand and analyze the source and the pattern of spread of COVID infection. GIS can also be used to monitor the available facilities and plan interventions accordingly. COVID-19 confirmed and active cases can be mapped to identify the source of infection.
- Map the travel history of an infected person and trace the people who came in contact using mobile phone signal.
- Prepare time-enabled map to identify and understand the spread over time, and plan interventions accordingly.
- Map demographics data, such as the elderly and those with chronic health condition, in order to monitor risk groups and susceptible regions.
- Predict the spread pattern using big data procured from different sources and advanced analytics.
- Map social media emotions across boundaries using hashtags.
- Leverage GIS enabled Augmented Reality (AR) to assess the epidemic zones and infection hotspots using 2D/3D maps.
- Use Geotag technology to monitor people who are under quarantine, if needed.
- Map available facilities, medical resources, and equipment, to understand the current and potential impact of COVID-19 spread.
- Prepare and share interactive dashboards and web maps to communicate the current situation and to identify preventive measures.
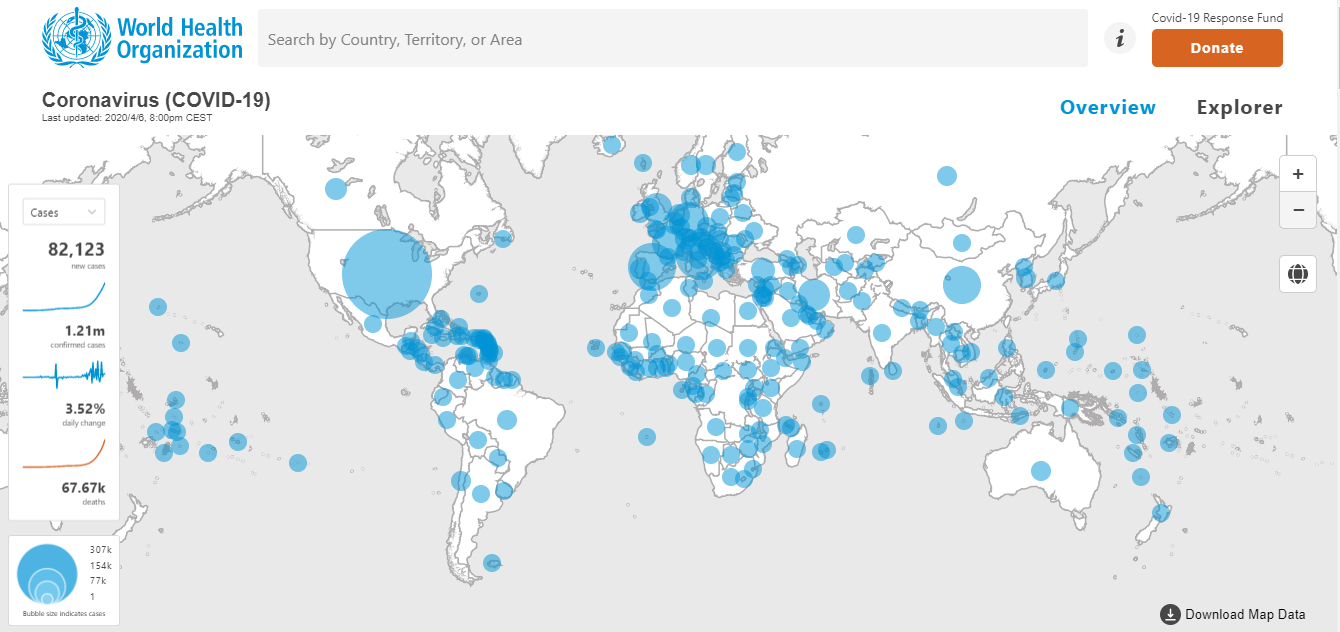
Going by the advantages of using GIS in the current situation, several portals have been created across the world to track and manage the impact of COVID-19 outbreak. Here are a few sample web portals and the live links:
1. Track the global spread of COVID-19 cases using World Health Organization’s Interactive web portal
2. National disaster management authority, India, has created an intuitive dashboard to track and monitor the COVID-19 spread across India. 
Using GIS to strengthen business continuity
In a business environment, it is essential to seek proactive measures in order to predict and analyze an organization’s risk areas, and also to measure operational capacity. Following are the ways in which GIS can help in maintaining business continuity in a pandemic situation:
- Map the organization’s facilities/resources/ODC’s that are under risk and monitor those for better decision making.
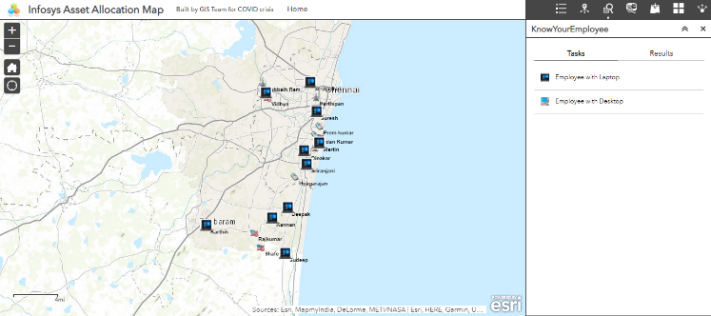
- Map employees using their home location and available assets for better management of assets and facilitate support for effective business continuity.
- Map employees using their home location and available assets for better management of assets and facilitate support for effective business continuity.
- The confirmed and active COVID cases should be mapped across delivery centers to plan the required measures for safety.
- Map employees according to their recent travel history and assist them accordingly with quarantine norms.
- Configure and share intuitive dashboards and interactive maps to communicate the current situation to decision-making stakeholders.

Sample interactive web application to monitor business operations: https://arcg.is/O9Xyi
Takeaways and recommendations
- Use GIS to investigate and determine the infected sources and monitor the probability of spread.
- Leverage location intelligence to monitor the spread of COVID-19 through space and time, to implement preventive and surveillance measures.
- Evaluate available facilities and healthcare capacity based on spread pattern.
- Predict and analyze organization’s risk areas and measure operational capacity using Geospatial technology to strengthen the business continuity.


